Client - Personal
Rendering / Texturing - Anthony Hearsey
Model - Based off Public Domain Australian Satellite Imagery
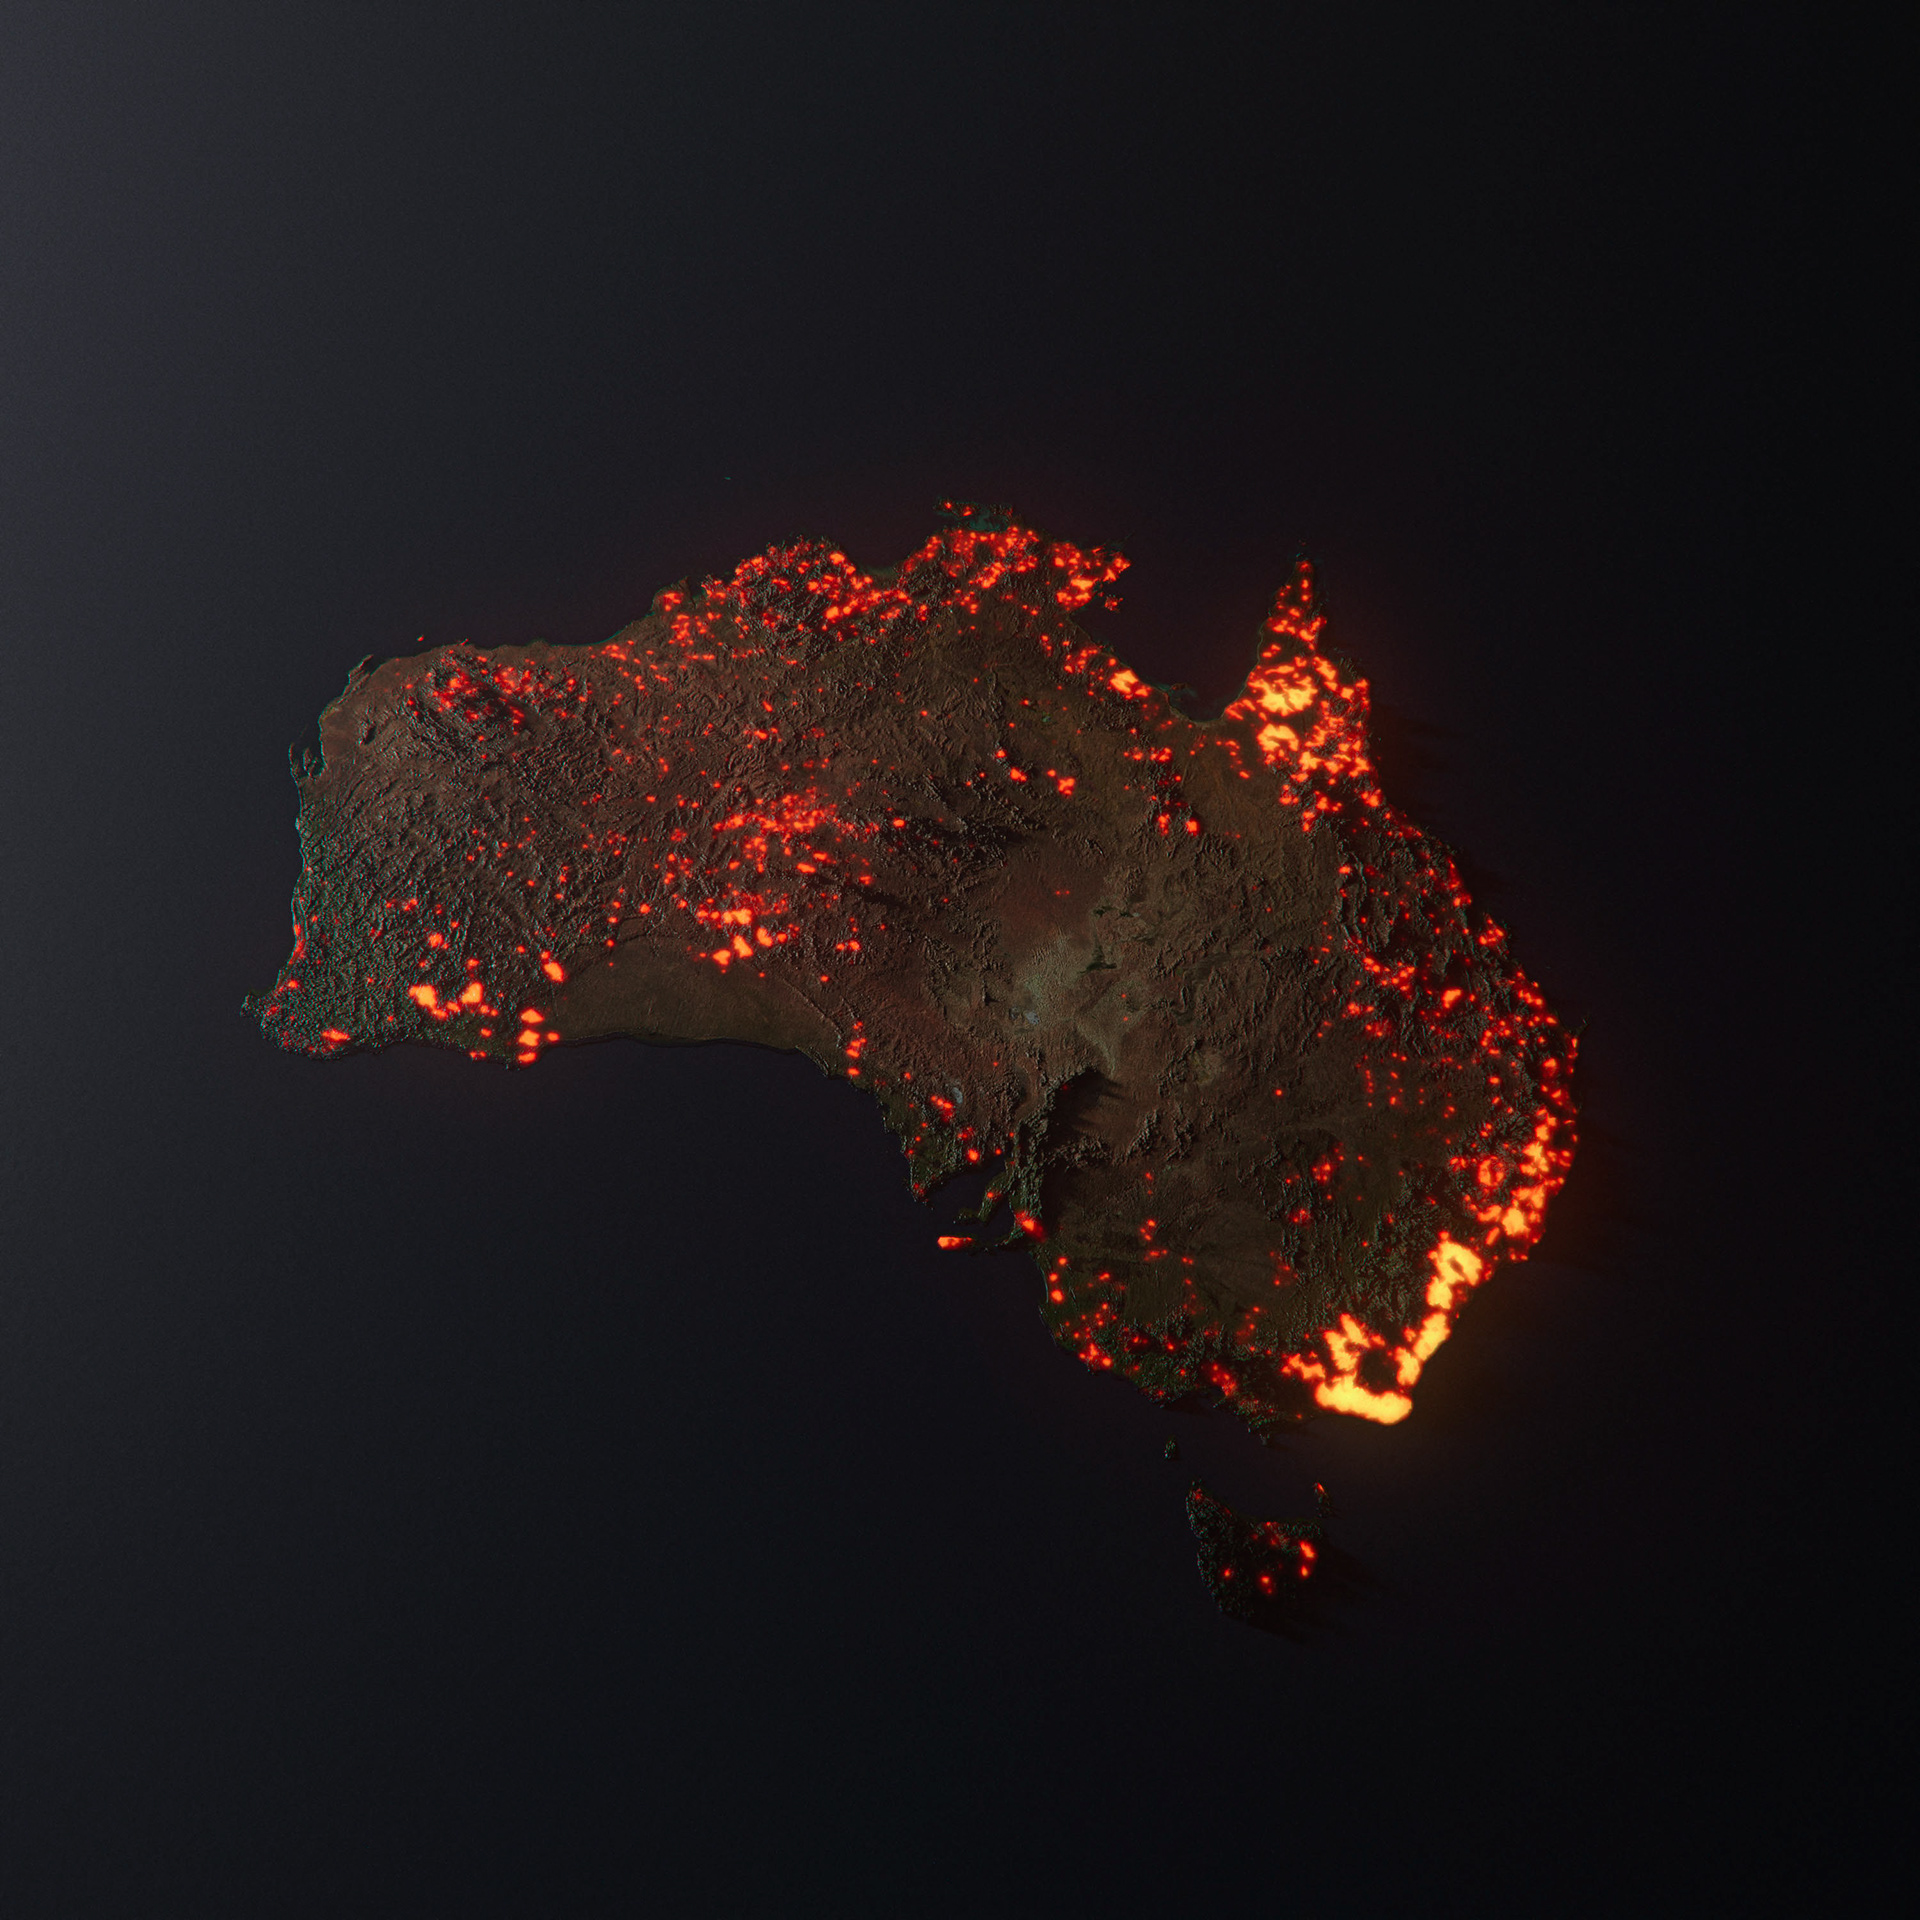
This is a 3D visualisation of the fires in Australia. NOT A PHOTO. Think of this a graph.
This is made from data from NASA’s FIRMS (Satellite data regarding fires) between 05/12/19 - 05/01/20.
These are all the areas which have been affected by bushfires.
NASA Source
Additionally, similar information can be viewed on the Australian Website
Scale is a little exaggerated due to the render’s glow, but generally true to the info from the
NASA website. Also note that NOT all the areas are still burning, and this is a compilation.
NASA website. Also note that NOT all the areas are still burning, and this is a compilation.
Australia needs your help.
Please donate to one of the many organisations.
DONATE HERE
_
DONATE HERE
_
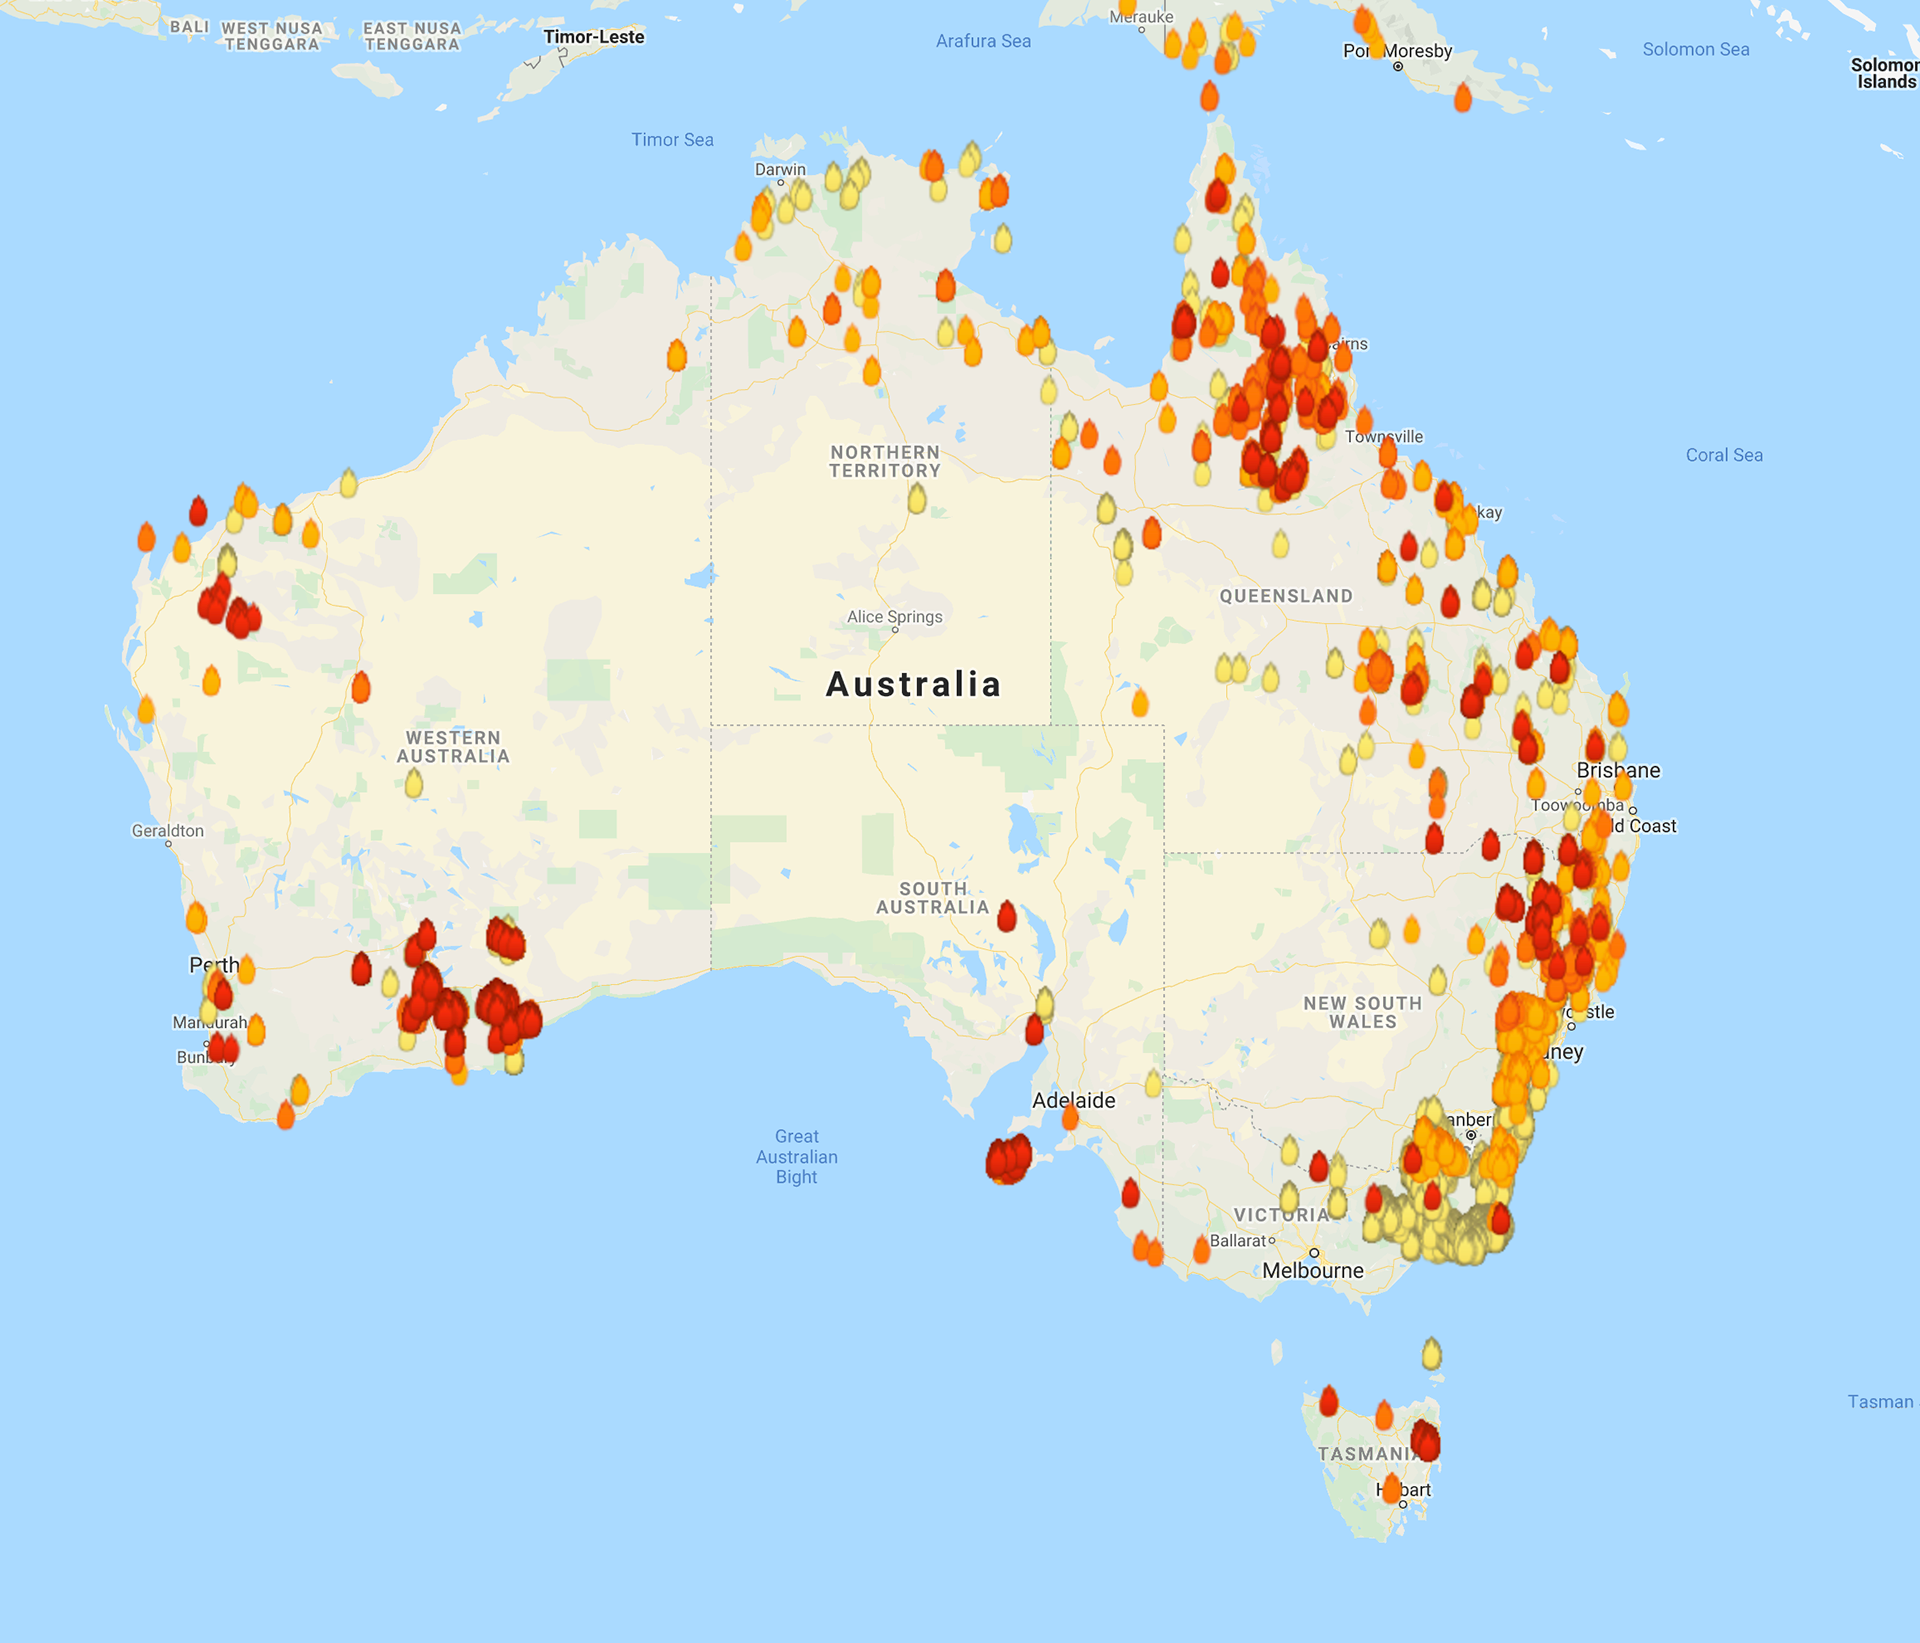
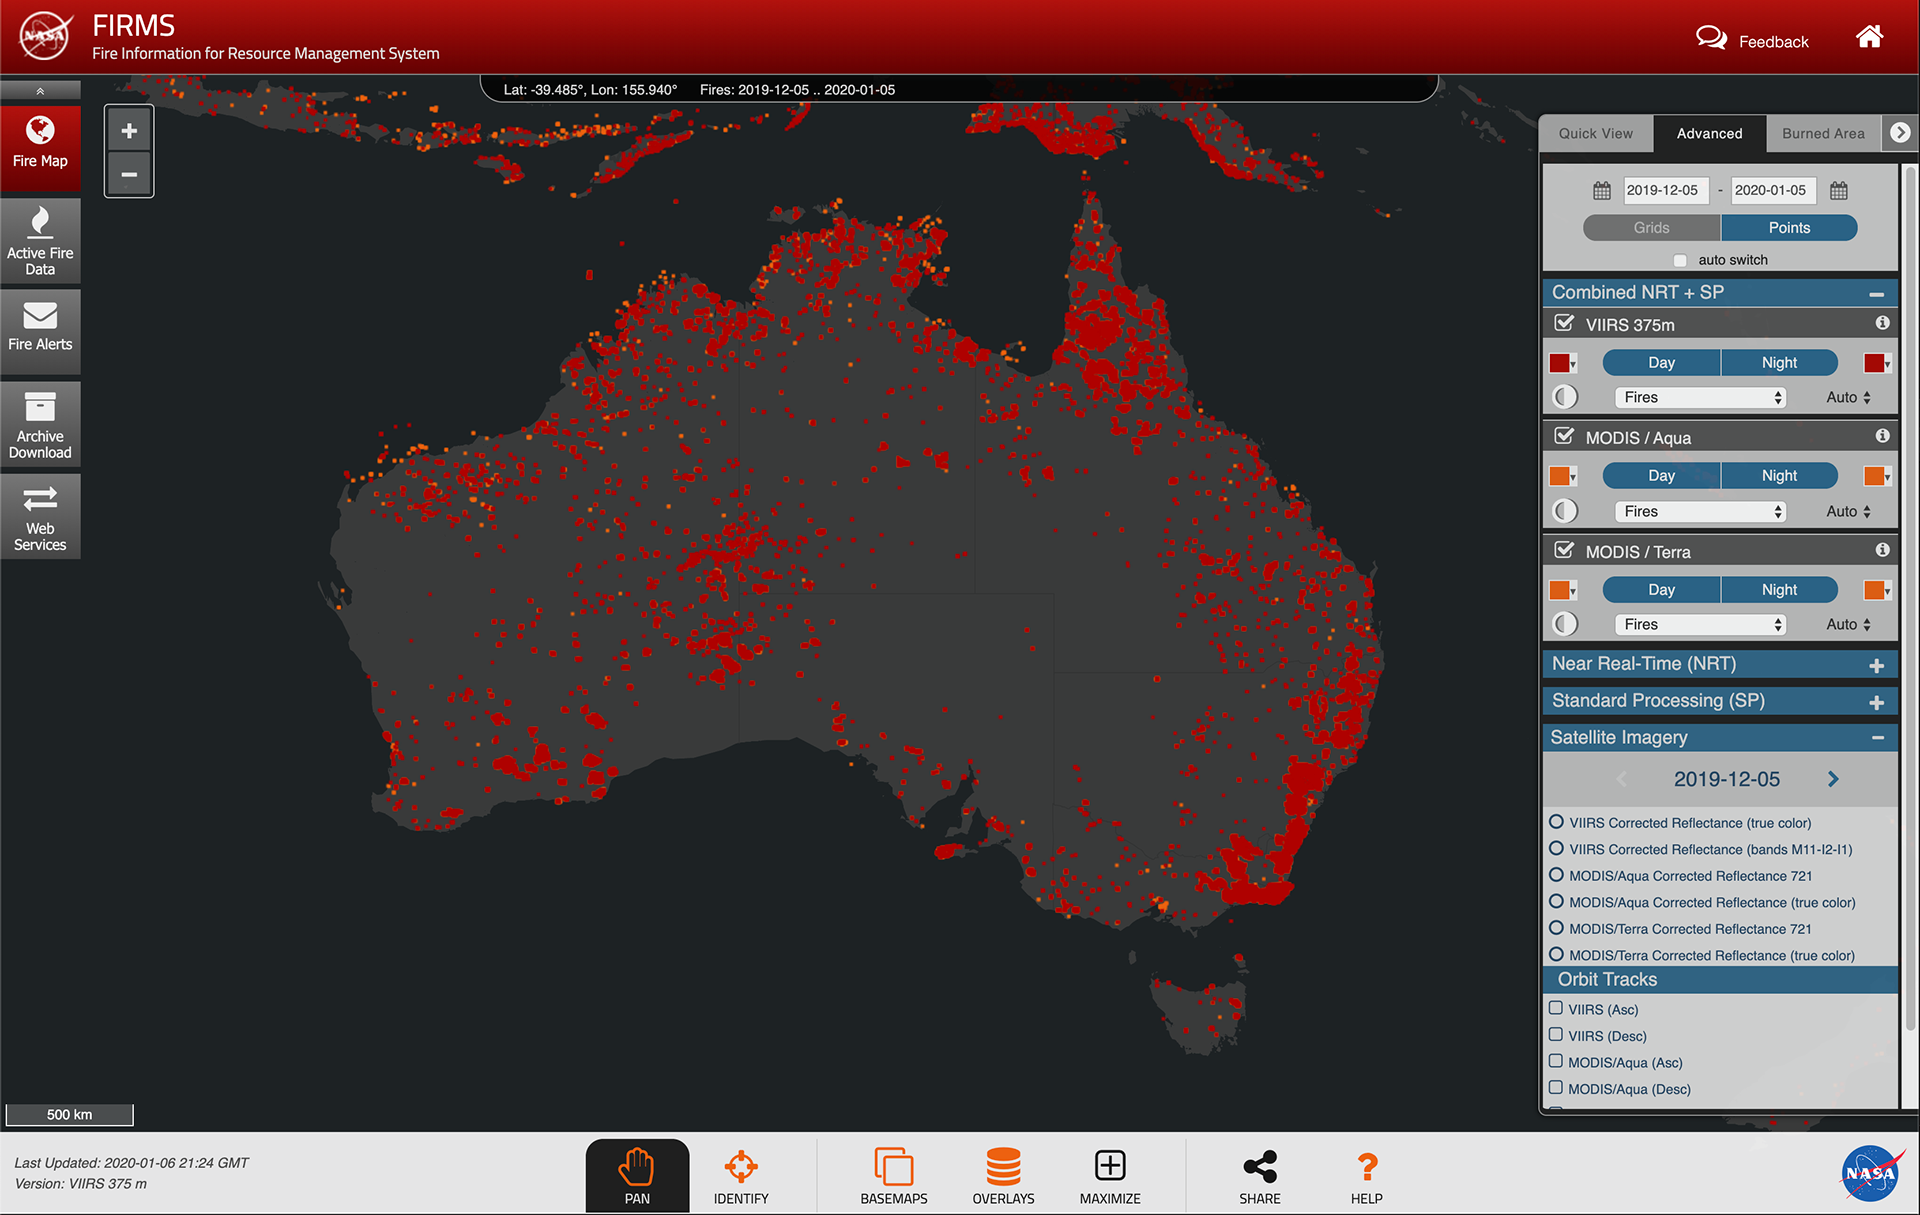
Source - NASA FIRMS, MYFIREWATCH Australia